You are not logged in. Log in
|
|
|
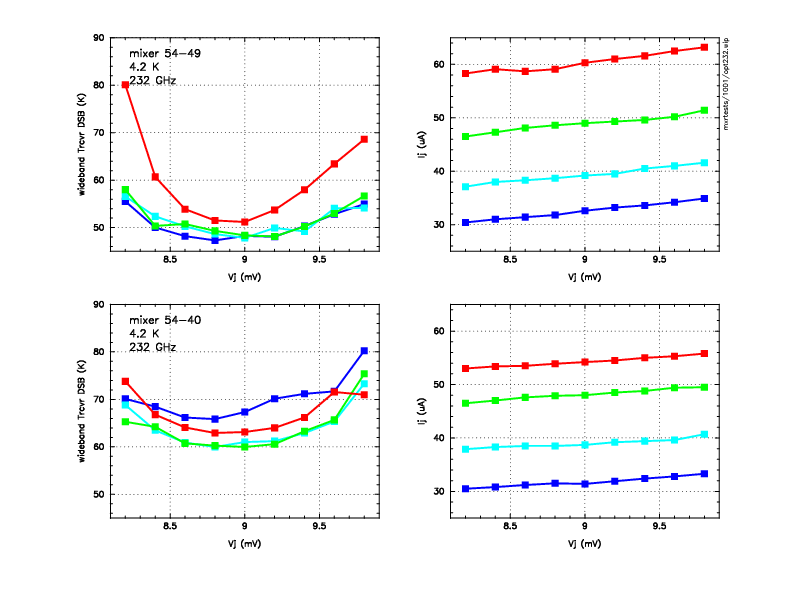
SIS Mixer tuningFrom $1Test results for mixers 54-49 and 54-40 in Berkeley, Oct 2014When these mixers were tested in Berkeley, the optimum bias was roughly 8.9 mV, 45 uA. Mixer 54-49 (LCP) had a lower noise temperature than mixer 54-40 (RCP), where these polarizations are the inputs to the dewar window (every reflection off a mirror flips the two polarizations). The plots below show the DSB receiver noise temperatures for the 2 mixers as a function of bias. These were derived from Y-factor measurements made with a power meter, with no bandpass limiting filters installed. No corrections were applied for optics losses or for 2nd stage noise contribution.
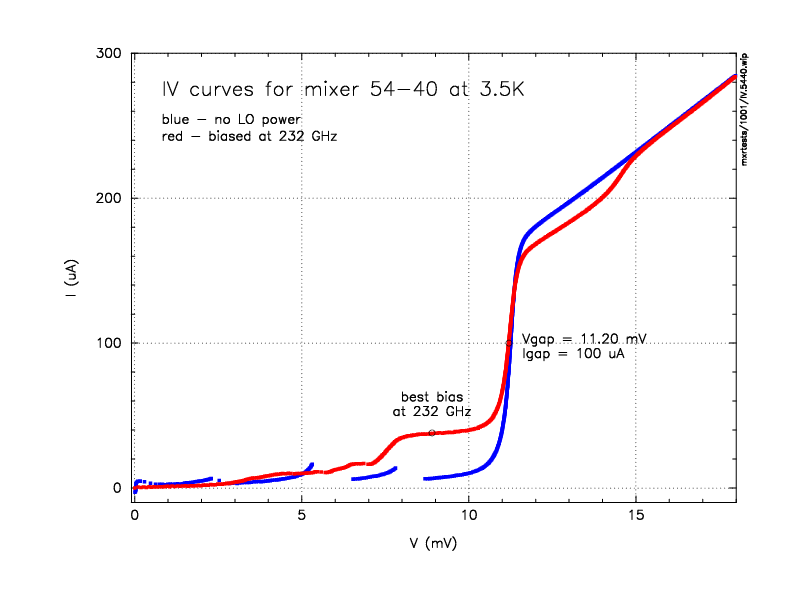
Here is the IV curve of mixer 54-40, with and without LO bias applied:
March 23 7:00 UT (1:00 am Local time)Aleks ran the auto-tuning function of the SIS software (CANbus). The voltages determined were just slightly smaller than a few days ago, but there is also more LO power coming in (4 uAmps additional current). The auto-tuned voltage is 8.80V, (measuring 61.3 uA) for the cable labeled lcp and 9.00V (measuring 57.5 uA) for the cable labeled rcp.
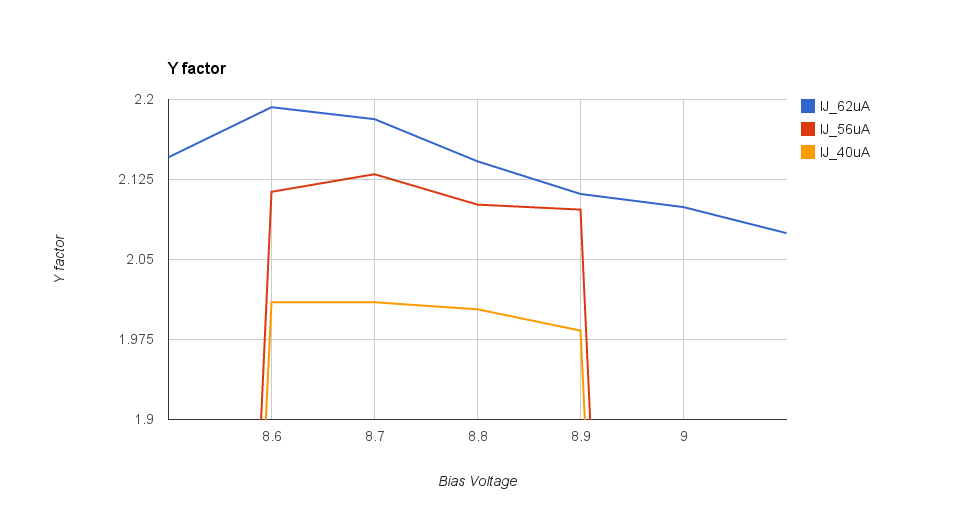
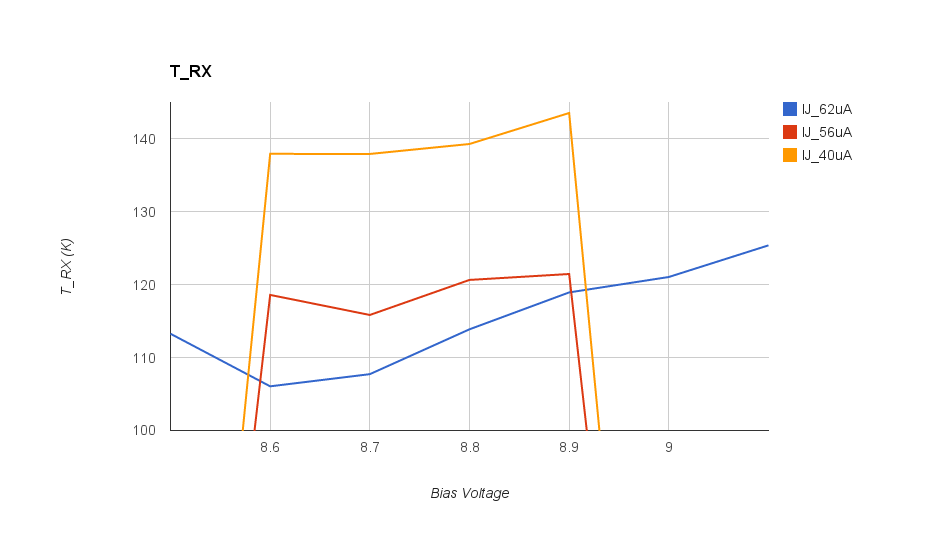
We performed a Y factor test on the channel labeled LCP on the bench. First we went through Bias Voltages at the LO power that produced around 62uA of current through the SIS junction. Next we tested a subset of Bias Voltages where we tuned the LO power down such that the current in the junction was roughly 56 uA and then 40 uA. Results of that test in the image below.
While performing the test we noticed the 10 MHz signal was very clear in the oscilloscope. We also noticed that changing the LO power such that the current in the junction was nearly 62 uA (the blue curve) reduced the power of this 10 MHz signal. It seemed to be the "sweet spot" for minimizing this signal.
We came back to the experiment an hour or so later, and checked the Y factor again and it was quite poor, even at the bias voltage and LO power that produced the minimum, and it gave a Y factor of 1.99 and T_RX of 140. There is a lot of variability here, tough to get clear values and minimums. Aleks reports in his lab notebook that in initial set up a few days ago they achieved a Y factor of 2.5 (RCP) and 2.22 (LCP). We were able to get as high as 2.19 with LCP today. Again we are reporting LCP and RCP as the label names coming out of the total power box (truthfully on the sky because of the mirrors these are flipped). March 23 08:55 AM UT (2:54 AM Local time)After removing M4 mirror (maybe an hour after the initial graphs and Y factor test), and proceeding with 3mm VLBI experiments, we re-ran some Y factor experiments, and are getting consistently poorer results on LCP. |
Powered by MindTouch Core |


