You are not logged in. Log in
|
|
|
Page last modified 21:40, 30 Apr 2015 by Dick Plambeck
CARMAFrom $1Table of contentsFrequency SetupCARMA provides 2 VLBI stations:
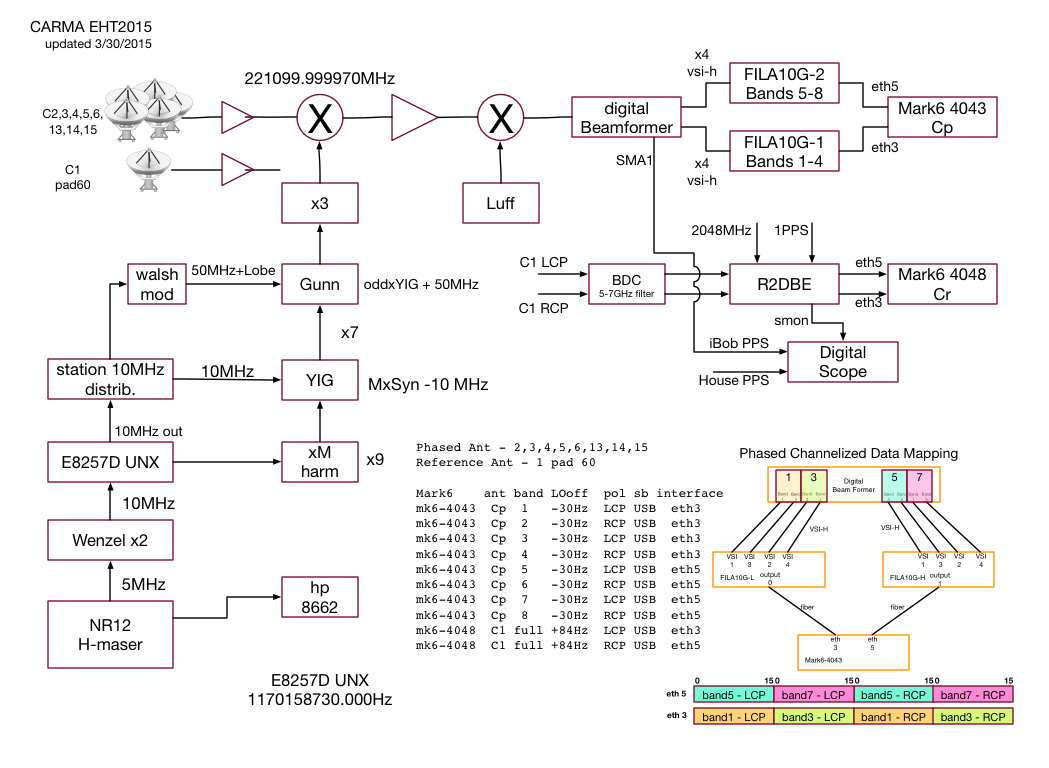
The exact LO1 frequency for the 2015 experiment is:
f(LO1) = 3 * (7 * (9 * fsynth - 10 MHz) + 50 MHz)
       = 221099.999970 MHz (for fsynth = 1170.158730 MHz)
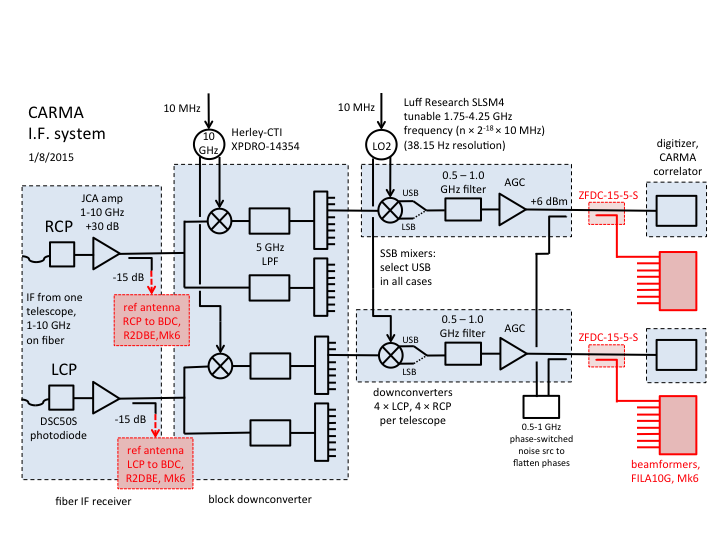
A diagram of the CARMA IF system is shown below. The signals for the reference antenna are taken from wideband directional couplers in the fiber IF receiver boxes; these 1-9 GHz bands are sent to standard EHT block downconvertes and R2DBEs. The signals for the beamformers are taken from the outputs of the CARMA analog downconverters.
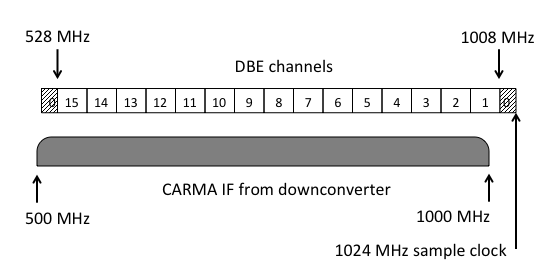
The beamformers are channelized as shown below (same as 2013):
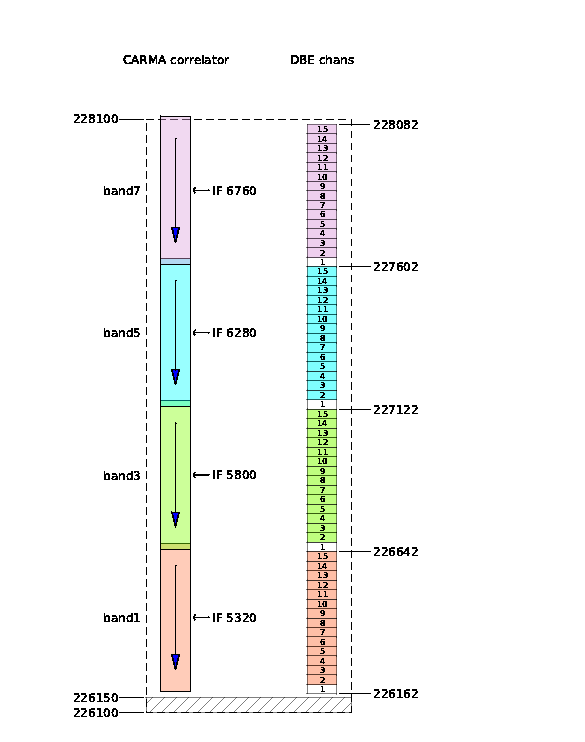
The sky frequencies corresponding to these channels are shown in the diagram below ("caseD") ;
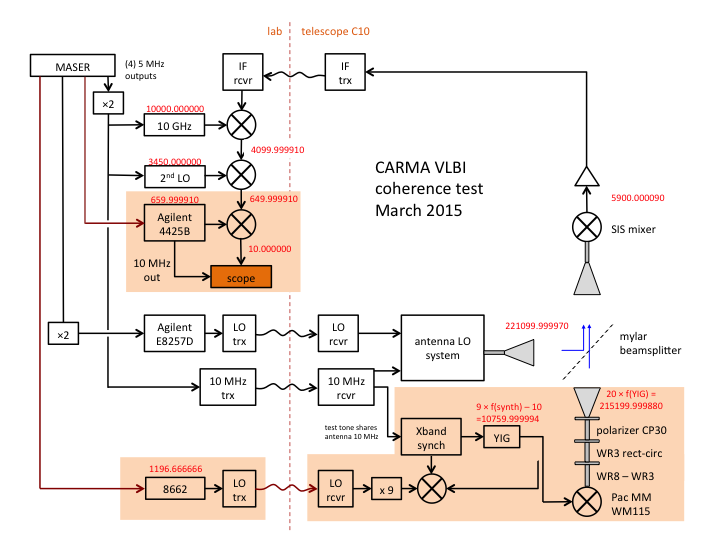
Coherence TestWe injected a 215.2 GHz tone into receiver on one antenna, derived from a separate synthesizer (HP 8662), locked to a separate 5 MHz output from the maser. We used a tone in the receiver's lower sideband because the harmonic generator seemed to work best at that frequency - to test coherence, the sideband shouldn't matter. The tone appeared at 650 MHz on output of CARMA downconverter. We mixed this down to 10 MHz in another mixer, using a 660 MHz LO from another synthesizer, again locked separately to one of the 5 MHz maser outputs. We examined this on a scope that was tirggered off the 10 MHz output of the final synthesizer. A block diagram of the setup is shown below. Shaded blocks indicate hardware associated with the test tone. Note that the Mixed this down to 10 MHz, examined with scope, triggering off 10 MHz (derived directly from maser). Block diagram of the setup is shown below. Shaded blocks indicate hardware associated with the test tone. Note that the tone is independent of the CARMA LO system, apart from the 10 MHz offset needed for the tone's Xband phaselock in the antenna - this was taken from the regular antenna 10 MHz distribution.
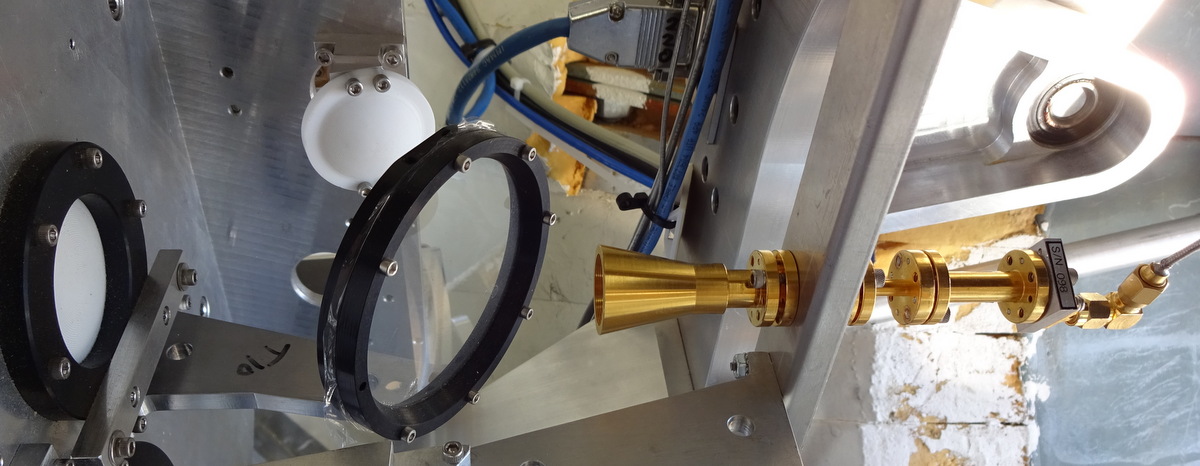
A photo of the harmonic generator mounted in front of the beamsplitter and dewar window:
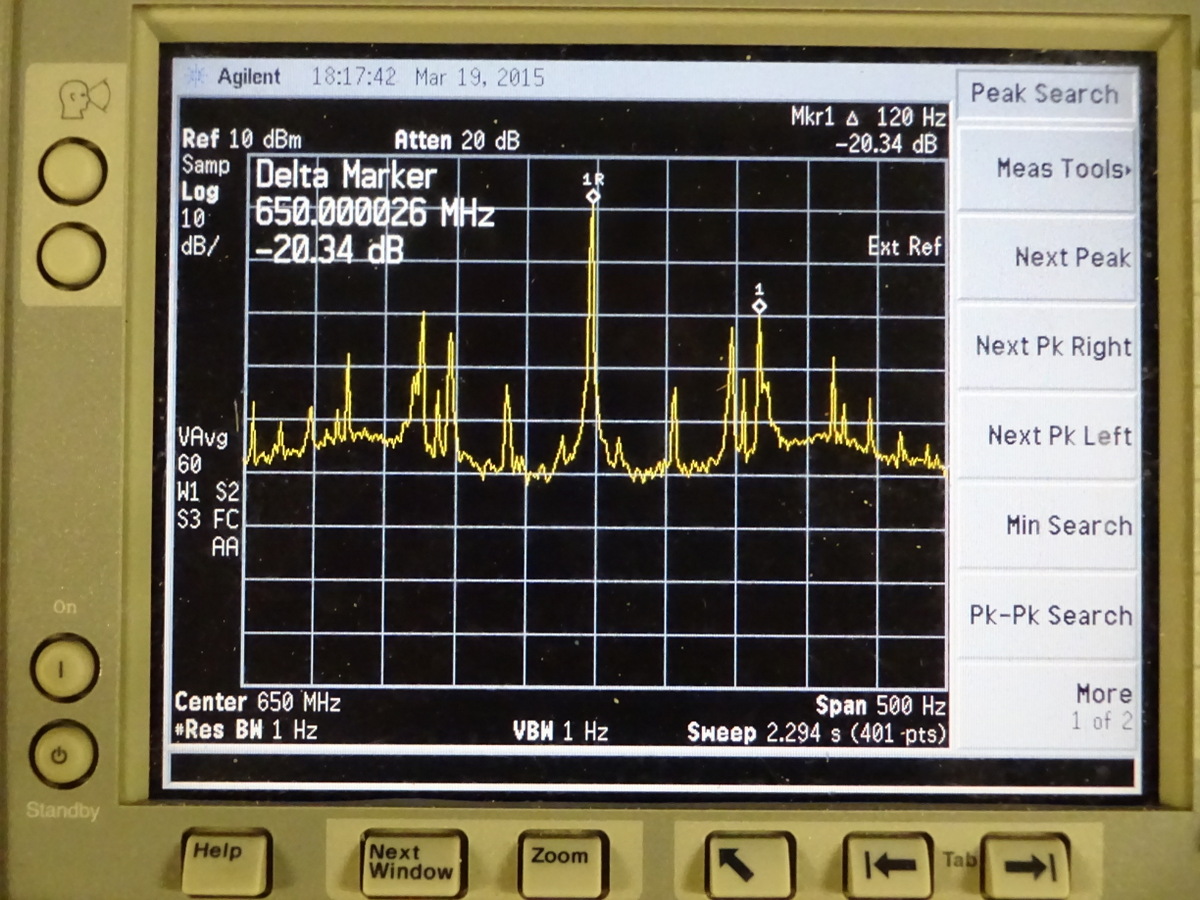
Test tone examined with 1 Hz resolution on a spectrum analyzer (500 Hz span): Here is a video of the tone - we change the scope averaging from 1 to 2 to 8 to 64 during the course of the recording. There is a small amplitude glitch about every 1 sec - not clear what this is due to, but should not have big impact on vlbi.
An overview diagram similar to previous years.
Flux calibrationUranus, Mars, and Callisto were used as primary flux calibrators for the VLBI sources. Uranus and Mars were daytime objects, observable only at the end of the VLBI schedules, whereas Callisto was up at night and could be interleaved into the middle of the schedule. The flux calibrator parameters are given in the table below:
For Uranus and Mars, the diameters and brightness temperatures are inserted into the Miriad header by the realtime CARMA system; program bootflux uses these values for calibration. For Callisto, we computed the flux density ourselves assuming a brightness temperature of 114 K (from Figure 10 in ALMA memo 594) and used program uvflux to return the measured value (restricting the uvrange to 0-30 klambda). Any antennas with anomalous gains on the flux calibrator (often, C1 and C2) or other obvious problems (often, C14 because its receiver gains were unstable) were omitted. A summary of the derived source fluxes is given in CARMA_fluxes_2015.pdf. For calibrating the SEFDs, we will adopt the average values shown in the shaded column. We note that CARMA fluxes are typically about 7% lower than SMA fluxes. |
||||||||||||||||
Powered by MindTouch Core |